Analyze, optimize, and grow with a detailed view of your CRM performance.
Unlock Data-Driven Success with Pipedrive Insights
We provide an overview of the power of Pipedrive Insights, emphasizing how tracking CRM data helps businesses make informed, data-driven decisions. Highlight the importance of having detailed insights into activities, deals, lead sources, and revenue forecasts to support strategic growth and enhance productivity.
Use Cases
Each report type is presented in a clear, visually separated format with an in-depth explanation combining both functionality and benefits.
New Activity Report
A comprehensive breakdown of all logged activities, including calls, emails, and meetings, categorized by type and frequency. By tracking and visualizing each activity, managers can identify which actions drive the most progress and which areas may need additional focus. This insight allows teams to align their daily efforts with broader goals, ensuring that high-value activities receive the most attention and time. It’s particularly valuable for identifying patterns in productive versus less effective actions, helping refine the approach to client engagement and relationship-building.
Deals Lost by Reasons
Understand why deals fail with detailed loss analysis. This report categorizes lost opportunities by specific reasons, helping you identify patterns in deal failures. Use these insights to address common objections, improve your sales process, and provide better training to prevent future losses.
Win vs. Loss Report
Compare your won and lost deals side by side to identify what separates success from failure. Analyze win rates by deal size, industry, lead source, and sales rep. This comparative analysis reveals your competitive advantages and areas needing improvement.
Leads Created by Users
Track lead generation performance across your team. See which team members are bringing in the most leads and the quality of those leads based on conversion rates. This helps balance lead distribution and identify top lead generators for best practice sharing.
Leads Conversion by Sources
Measure the effectiveness of different lead sources and marketing channels. Track conversion rates from initial lead to closed deal by source. Optimize your marketing spend by investing in high-converting sources and improving or eliminating underperforming channels.
Customer Sources
Analyze where your best customers come from. This report breaks down customer acquisition by source, showing not just volume but also customer lifetime value and retention rates by channel. Focus your efforts on sources that bring in high-value, long-term customers.
Products Sold by Customer
Track product performance and customer buying patterns. See which products sell best, common product combinations, and purchase frequency. Use this data for cross-selling, upselling, and inventory planning.
Deals Won Over Time
Monitor your sales performance trends over weeks, months, or quarters. Identify seasonal patterns, growth trajectories, and the impact of sales initiatives. This historical view helps with accurate forecasting and resource planning.
Deals Added (Goal-Based Report)
Track progress toward new deal creation goals. Monitor how many deals enter your pipeline daily, weekly, or monthly against set targets. This helps ensure consistent pipeline generation and early warning of potential revenue gaps.
Forecasted Monthly Revenue (Weighted by Probability)
Get accurate revenue predictions based on deal probability and expected close dates. This weighted forecast accounts for deal stage and historical conversion rates, providing realistic revenue projections for better business planning.
Average Value of Won Deals
Track your average deal size over time to understand pricing trends and sales performance. Identify which types of deals, customers, or sales reps consistently achieve higher values. Use this to set realistic targets and focus on high-value opportunities.
Average Open Deal Value
Monitor the health and potential of your active pipeline. This report shows the average value of deals currently in progress, helping you understand pipeline quality and make decisions about resource allocation and sales focus.
Report on Milestone Meetings
Track critical customer interactions and their outcomes. Monitor completion rates for important meetings like demos, proposals, and negotiations. Understand which meeting types most influence deal success and optimize your sales process accordingly.
Total Calls Monthly Segmented by Users
Analyze call activity patterns across your sales team. See who’s making the most calls, when they’re most active, and how call volume correlates with results. Balance workloads and identify coaching opportunities for improved phone performance.
Calls by User
Deep dive into individual calling performance. Track call duration, frequency, and outcomes by sales rep. Use this data for performance reviews, training needs identification, and best practice development.
Call Type Report by User
Categorize and analyze different types of calls (cold calls, follow-ups, demos, support) by team member. Understand which call types are most effective and ensure your team spends time on high-value conversations.
What Are Pipedrive Insights and Why Your Sales Team Needs Them
Pipedrive Insights is the analytics powerhouse within your CRM that transforms scattered sales data into clear, visual intelligence. Think of it as your sales team’s mission control – showing exactly where deals get stuck, which activities drive revenue, and which reps need coaching.
Most sales teams are sitting on a goldmine of data but lack the tools to mine it effectively. Without proper insights, you’re essentially guessing which leads to prioritize, which sales activities actually work, and why deals fall through. Pipedrive Insights changes that by delivering real-time analytics that answer your most critical sales questions.
Key Pipedrive Insights Features That Drive Sales Performance

Visual Sales Dashboard
Get an instant bird's-eye view of your entire sales operation. Monitor deal velocity, conversion rates, and revenue forecasts in real-time. Customize widgets to track the KPIs that matter most to your business – from average deal size to sales cycle length.

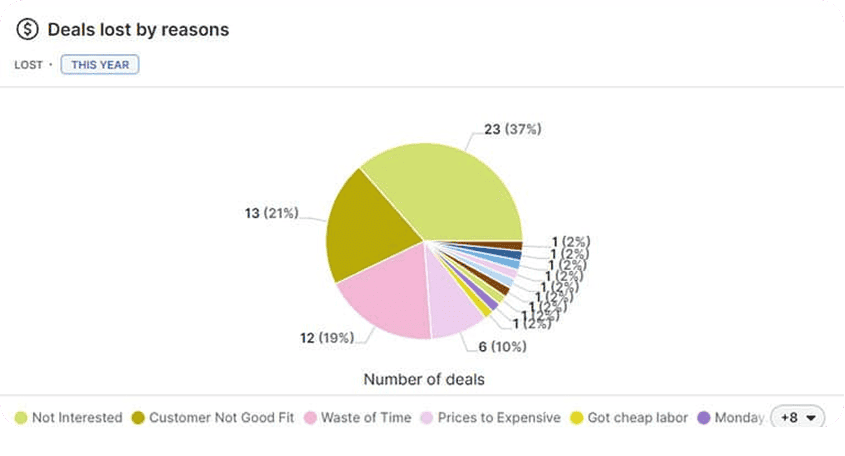
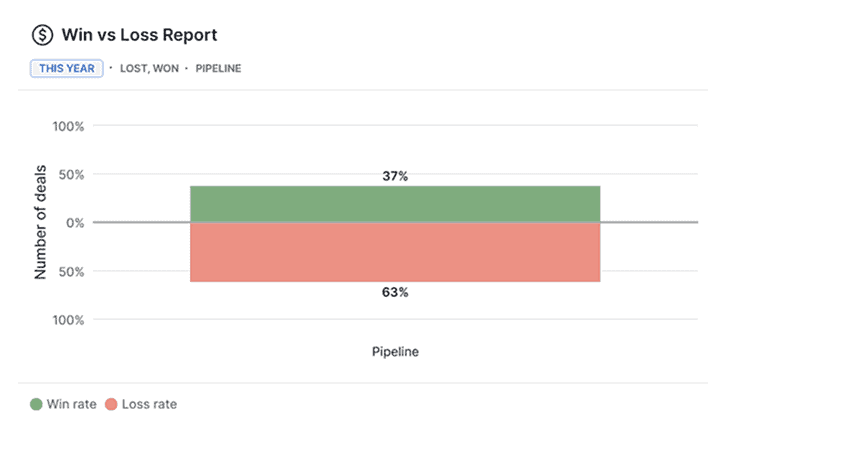
Deal Performance Analytics
Understand exactly why deals win or lose. Track deal progression through each pipeline stage, identify bottlenecks where deals stagnate, and spot patterns in successful conversions. Our clients typically discover 2-3 critical bottlenecks they never knew existed.

Team Performance Metrics
Compare individual and team performance across key metrics like activity levels, conversion rates, and revenue generated. Identify your top performers' winning behaviors and replicate them across your team. Track activity-to-outcome ratios to optimize your sales process.

Revenue Forecasting
Predict future revenue with confidence using weighted pipeline analysis. Pipedrive's probability-based forecasting helps you understand if you'll hit targets weeks in advance, giving you time to course-correct. Set realistic quotas based on historical performance data.
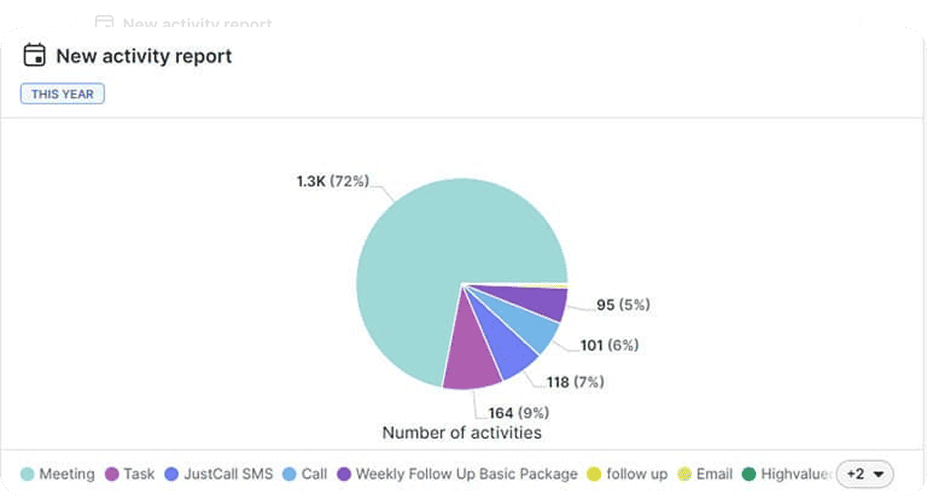
Activity Insights
Discover which sales activities actually move the needle. Track email open rates, call success rates, and meeting-to-close ratios. Stop wasting time on activities that don't convert and double down on what works.

Lead Source Analysis
Identify your most profitable lead sources and marketing channels. Track ROI by source, understand customer acquisition costs, and optimize your marketing spend based on actual conversion data.
How CRM Squirrel Maximizes Your Pipedrive Insights ROI
Custom Report Configuration
We don't just turn on reports – we build custom analytics frameworks aligned with your specific sales methodology. Whether you're tracking SaaS metrics like MRR and churn or B2B metrics like deal velocity and win rates, we configure Insights to answer YOUR critical business questions.
Advanced Segmentation Setup
Slice and dice your data by product line, territory, deal size, industry, or any custom field that matters to your business. We help you build segments that reveal hidden patterns and opportunities.
Goal and Target Integration
Set up cascading goals from company level down to individual reps. Track progress in real-time with automated alerts when targets are at risk. We align your Insights with your actual business objectives, not generic metrics.
Automated Reporting Workflows
Stop spending hours building weekly reports. We set up automated report generation and distribution, ensuring stakeholders get the right insights at the right time. From daily activity summaries to monthly board reports – all automated.
Real-World Results: How Businesses Win with Pipedrive Insights
SaaS Company Reduces Sales Cycle by 32%
By analyzing deal velocity data, we identified that deals stalling in the “Proposal Sent” stage for more than 5 days had a 70% lower close rate. Implementing automated follow-ups at the 3-day mark increased overall close rates by 18%.
B2B Service Provider Increases Average Deal Size by 45%
Insights revealed that deals including a specific add-on service had 2.3x higher lifetime value. The sales team shifted focus to bundling, resulting in significant revenue growth without increasing lead volume.
E-commerce Brand Improves Lead Response Time by 400%
Activity insights showed leads contacted within 1 hour converted at 5x the rate of those contacted after 24 hours. Implementing real-time lead alerts and response tracking transformed their conversion rates.
Pipedrive Insights vs. Basic CRM Reporting
| Standard CRM Reporting | Pipedrive Insights with CRM Squirrel |
|---|---|
| Static monthly reports | Real-time dynamic dashboards |
| Basic win/loss rates | Deep funnel analysis with bottleneck identification |
| Individual performance only | Team trends and pattern recognition |
| Historical data only | Predictive forecasting and trend analysis |
| Generic metrics | Custom KPIs aligned with your business model |
| Manual report creation | Automated insight generation and alerts |
Advanced Insights Strategies for Scaling Teams
Cohort Analysis for Customer Success
Track customer cohorts through their lifecycle to identify patterns in churn, upsell opportunities, and lifetime value. Understand which customer segments are most profitable and why.
Multi-Pipeline Analytics
For businesses with multiple products or markets, we configure cross-pipeline analytics to understand resource allocation, identify cross-sell opportunities, and optimize team assignments.
Custom Calculated Metrics
Beyond standard metrics, we create custom calculations specific to your business – from customer acquisition cost (CAC) to sales velocity formulas tailored to your sales cycle.
Common Pipedrive Insights Mistakes (And How to Avoid Them)
Tracking vanity metrics instead of revenue drivers – Focus on metrics that directly impact revenue and growth.
Information overload with too many reports – Start with 5–7 key metrics and expand gradually.
Set-and-forget mentality with dashboards – Review and refine insights monthly based on business changes.
Ignoring data quality issues – Implement data hygiene processes from day one.
Try our 45-day free trial today
We offer a comprehensive range of services to optimize your Pipedrive CRM and supercharge your sales processes. Our goal is to provide tailored solutions that address your specific needs and drive measurable results.
What's the difference between Insights and regular Pipedrive reporting?
Insights provides visual dashboards, custom calculations, goal tracking, and predictive analytics. Regular reporting gives you raw data; Insights transforms that data into actionable intelligence with trends, forecasts, and performance comparisons.
Can we create custom KPIs specific to our business model?
Yes, we build custom metrics beyond Pipedrive’s defaults. Whether it’s customer acquisition cost, sales velocity, or industry-specific metrics like utilization rates or recurring revenue, we configure Insights to track what matters to you.
How often should we review our Pipedrive Insights dashboards?
Daily for activity metrics, weekly for pipeline health, and monthly for trend analysis and goal tracking. We set up automated report distribution so the right insights reach the right people at the right frequency.
Can Insights data be exported for board meetings or investors?
Absolutely. We configure professional report exports, create investor-ready dashboards, and can integrate with tools like Google Sheets or Power BI for advanced visualization and presentation needs.
What's required to get accurate data in Pipedrive Insights?
Clean, consistent data entry is essential. We implement required fields, validation rules, and regular data audits. We also train your team on proper data hygiene practices to ensure your insights remain reliable.